-
Blackboard Exemplary Course Program 2013 Update: No sour grapes…really!

Blackboard Exemplary Course Program 2013 Update: This year I’ve had the pleasure of collaborating closely with my colleagues to support and oversee our institutions’ debut submission of courses to the 2013 Blackboard Exemplary Course Program (ECP). As mentioned in my first ECP post back in January, the aim of the program is to support the use of e-Learning technology more effectively by identifying and disseminating best practices for designing engaging online courses.
Prior to the 2013 program commencing I was aware that some of our academics were considering the idea of submitting their courses for review, so with some internal promotion and the introduction to the Blackboard ECP rubric, we set out to inspire our academics to take the plunge and commit to submitting their courses.
My first step was to advise our academics to self-evaluate their own courses using the very comprehensive ECP rubric. The ECP rubric recommends best practices and gave our tutors the ability to effectively asses the standard of their course and reveal areas of strength as well as identifying any weaknesses where their design may have fallen short. Make no mistake, this is not something to be taken lightly as the ECP rubric criteria covers areas such as course design, interaction, collaboration, assessment and learner support. The immediate benefits where obvious; for our academics, this was a valuable and rare opportunity to undertake a reflective, self-evaluation of their course. By using the rubric to review our course submissions, it has also internally enriched our institutions baseline courses, which in return has given our students an improved learning experience.
Unfortunately this year we didn’t win an ECP award, but we did come close by collecting the ‘Exemplary’ stamp of approval on a number of key areas from the majority of the reviewers. Each one of our submitted courses received highly detailed, peer-reviewed feedback once the program had finished. This feedback was prepared by a panel of reviewers who volunteer their time and expertise to review our courses against the ECP rubric and the evidence we provided. Each of the comments we received where a well-informed snapshot of each course and has provided an invaluable perspective and ideas for improvement.
I’ve already begun preparing myself to support next year’s submissions by enrolling on the July 2013 Blackboard Exemplary Course Cohort to gain more insight on the areas that need further development. With new ideas and lessons to be learnt from the upcoming Exemplary Course Cohort and the development of elements from our ECP 2013 feedback, we will return to showcase even stronger examples of exemplary courses from Edge Hill University in 2014.
If you would like to participate in next year’s Blackboard ECP program, I highly recommend you also enrol on the July 2013 Exemplary Course Cohort (four week online course) to gain additional information on its process as well as its requirements.
Look out for more updates throughout the coming months and of course, feel free to get in touch with me at [email protected] if you have any questions or would simply like to know more.

Mark Wilcock
Learning Technology Development Officer
-
Introducing Service Pack 12: A look at what’s next for Learning Edge – July 2013 upgrade
 Over the years, there have been significant system upgrades implemented to Learning Edge (Blackboard 9.1) which have added many new features as well as an improved overall user experience. The next upgrade to Learning Edge is scheduled for July 21st-22nd, 2013, this is when the system will be unavailable for a short time – However we will continue to update you with further information closer to the time.
Once the work is complete, you will be able to log in as normal but will notice a number of enhancements.This upgrade will provide an even more user friendly and modern experience for students and staff alike. Many existing features have been improved and some exciting new features added to make the user experience more efficient.
The following is a quick overview of the tools* that you can expect to be using soon:
*Subject to change and agreement of social ‘cloud’ policy and testing.
Global Navigation
The new Global Navigation feature refers to the set of links that appears at the very top right of the Blackboard Learn frame. This set of links has been streamlined and becomes the entry point to My Blackboard and social learning tools. Access points to critical academic information are organised in one place to provide a consistent, quick, and easy way to find information.
My Blackboard
The new My Blackboard feature provides information from across Learning Edge for users. Users access My Blackboard via the new Global Navigation Menu at the top of the screen. My Blackboard has a navigation panel that quickly connects to the new My Blackboard tools – Profile, Updates, People, and Posts – as well as courses, organisations, and settings.
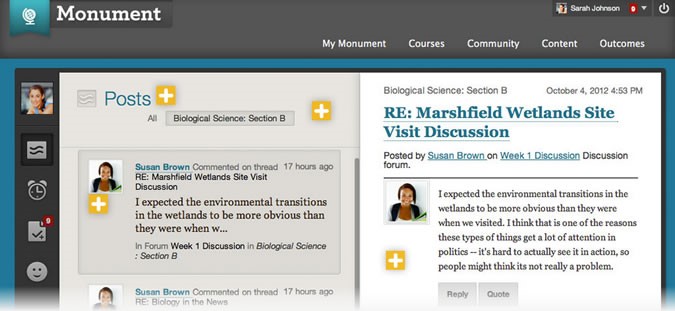
Discussions
With this enhancement, Blackboard have thoroughly revamped the look and feel of this tool. The first thing you’ll notice are the large avatars or profile pictures, so it’s a lot easier to identify tutors or students. And now you can see all threads on one page, but if this gets overwhelming, you have the ability to collapse and expand them.
Something you’ll all like is this new post first feature. If used, this will force students to write their own posts before seeing what their peers have written to encourage critical and original thinking.
Highlights include:
- All posts on one page: The entire discussion thread appears on a single page, thereby maintaining the context of posts and replies to one another.
- Avatars: The user profile avatars are more prominent in the new Discussions.
- Conditional highlighting of instructors’ posts: It is easier for students to find posts from instructors in a sea of other posts.
- Respond to posts inline: When clicking “Reply”, the content editor appears in the context of the discussion so as not to disrupt the flow of the user. The full content editor is available for the user to write a reply. When finished, submitting the post adds it directly into the page without losing context.

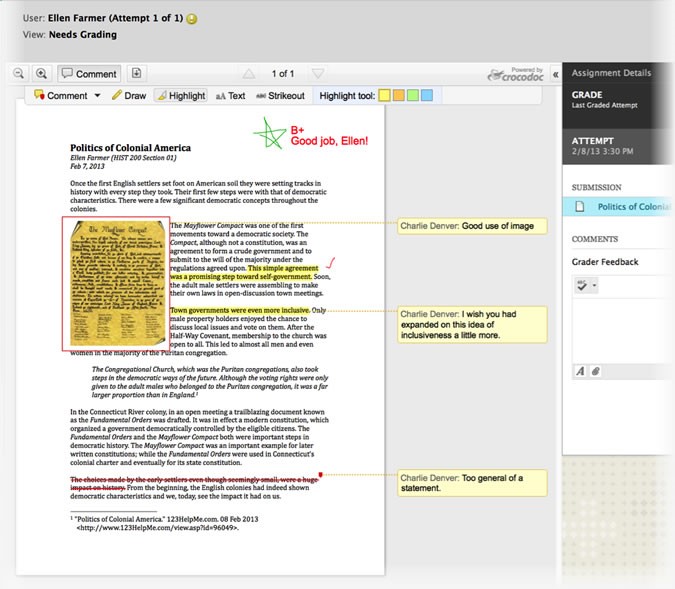
Inline Assignment Grading
Inline Assignment Grading is a revision to the workflow for grading submissions via the Assignment tool. Now instead of downloading the files that you need to view, edit and grade, you can view the Word, Excel, PPT docs or PDFs “inline” within Learning Edge. Instead of downloading student-submitted files to view or edit, you will now be able to view student-submitted files “inline,” i.e. in the web browser, without requiring any plugins, applets, or client-side applications.
Additionally, annotation tools will be made available as part of the inline viewer, enabling tutors to provide feedback including comments, highlights, and even drawings/annotations directly on the inline view of the document.
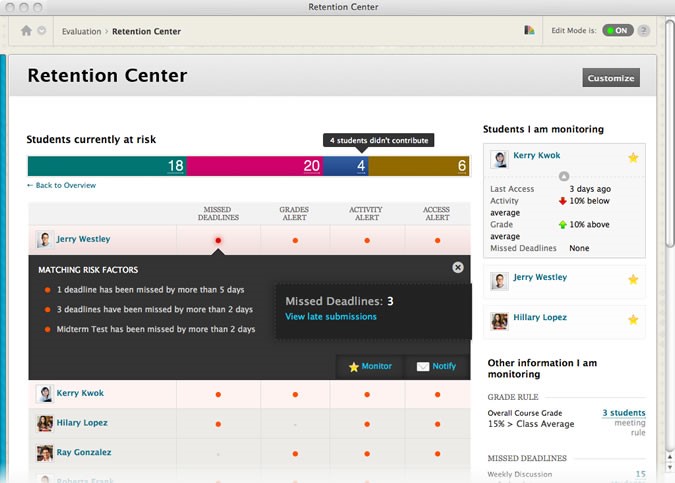
Retention Center
The brand new Retention Center provides an easy-to-use data visualisation and pre-configured rules for identifying at-risk students in a course. Because it requires no set up on the part of the tutor or administrator, it automatically calls out students who may need the tutor’s attention, making it easy for tutors to catch and respond to risk factors quickly, while there is time to help the at-risk students succeed in the course.
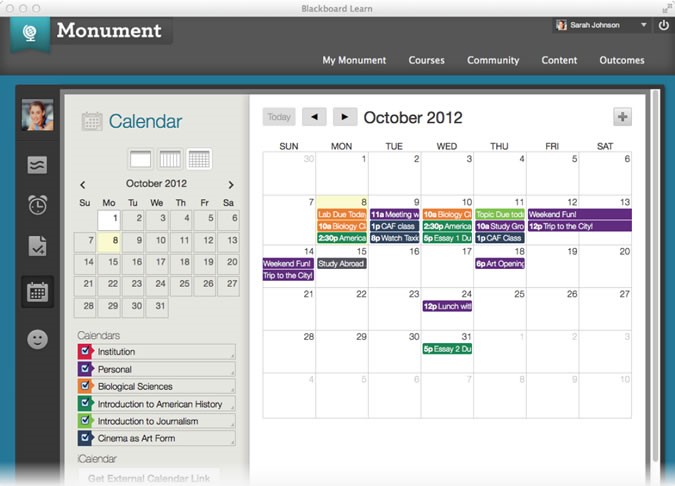
New Calendar
With this new calendar, you can spend less time organising your calendar and more time doing what’s on it. Consolidate your course items into this easy-to-use calendar. Add events, drag and drop to change due dates, input course reminders.
Students and tutors can view items that are past due, due today, or due this week by navigating to the overview capability in My Blackboard. From the image below you can see that it’s much more modern, in terms of both look and functionality.
You can select views (month, week, and day) and color-code the events to differentiate courses and personal items. Items with due dates automatically appear on the new Learning Edge calendar. If you change a due date within a course area, the calendar gets updated for students as well.
Calendar events may be viewed at once– or filtered to show only the desired mix of class and personal events. Users can select which calendars to view, ranging from personal to institution to individual course listings. These calendar items can also be exported via an iCal feed to Outlook, Google or other 3rd party calendars.
Assessment Item Analysis
The new Item Analysis provides statistics on overall test performance and on individual test questions. This data helps faculty recognise questions that might not adequately discriminate between students who understand the material and those who do not. Faculty can use this information to improve questions for future tests or to adjust marks on current attempts. Ineffective or misleading questions are identified easily, corrected in the Test Canvas, and are re-graded automatically.

We hope you like the look of these new features and would be happy to hear your thoughts via the comments section below.
If you have any queries regarding this upgrade please don’t hesitate to contact the Learning Technology Development team on 01695 650754 or via [email protected]
Mark Wilcock
Learning Technology Development Officer
-
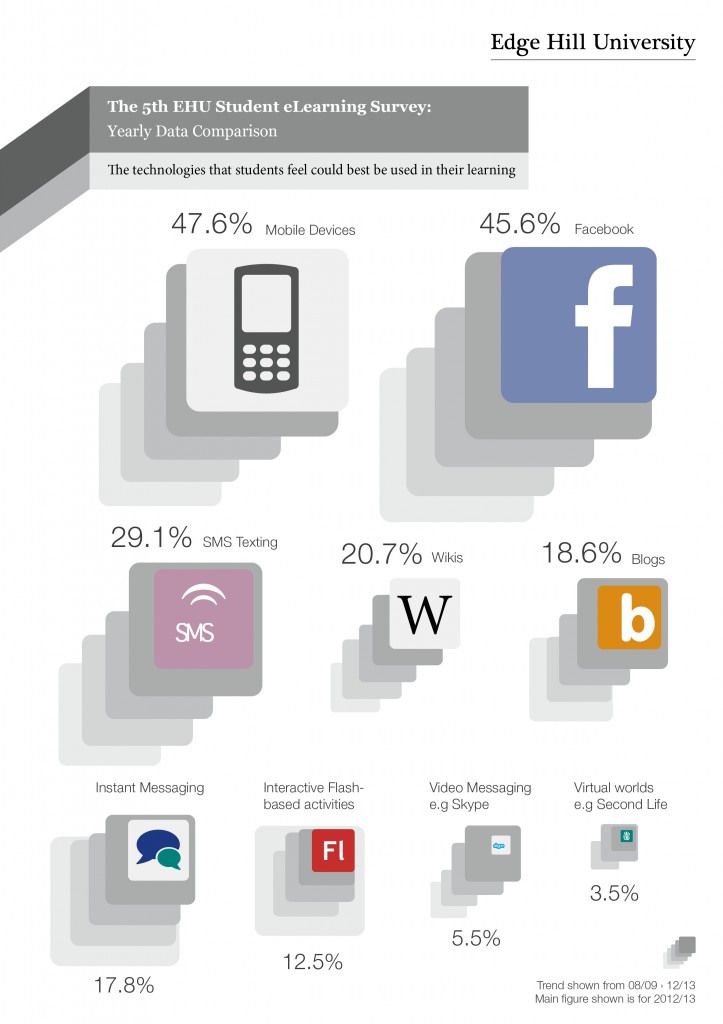
Doing something different with data – using infographics to showcase your research
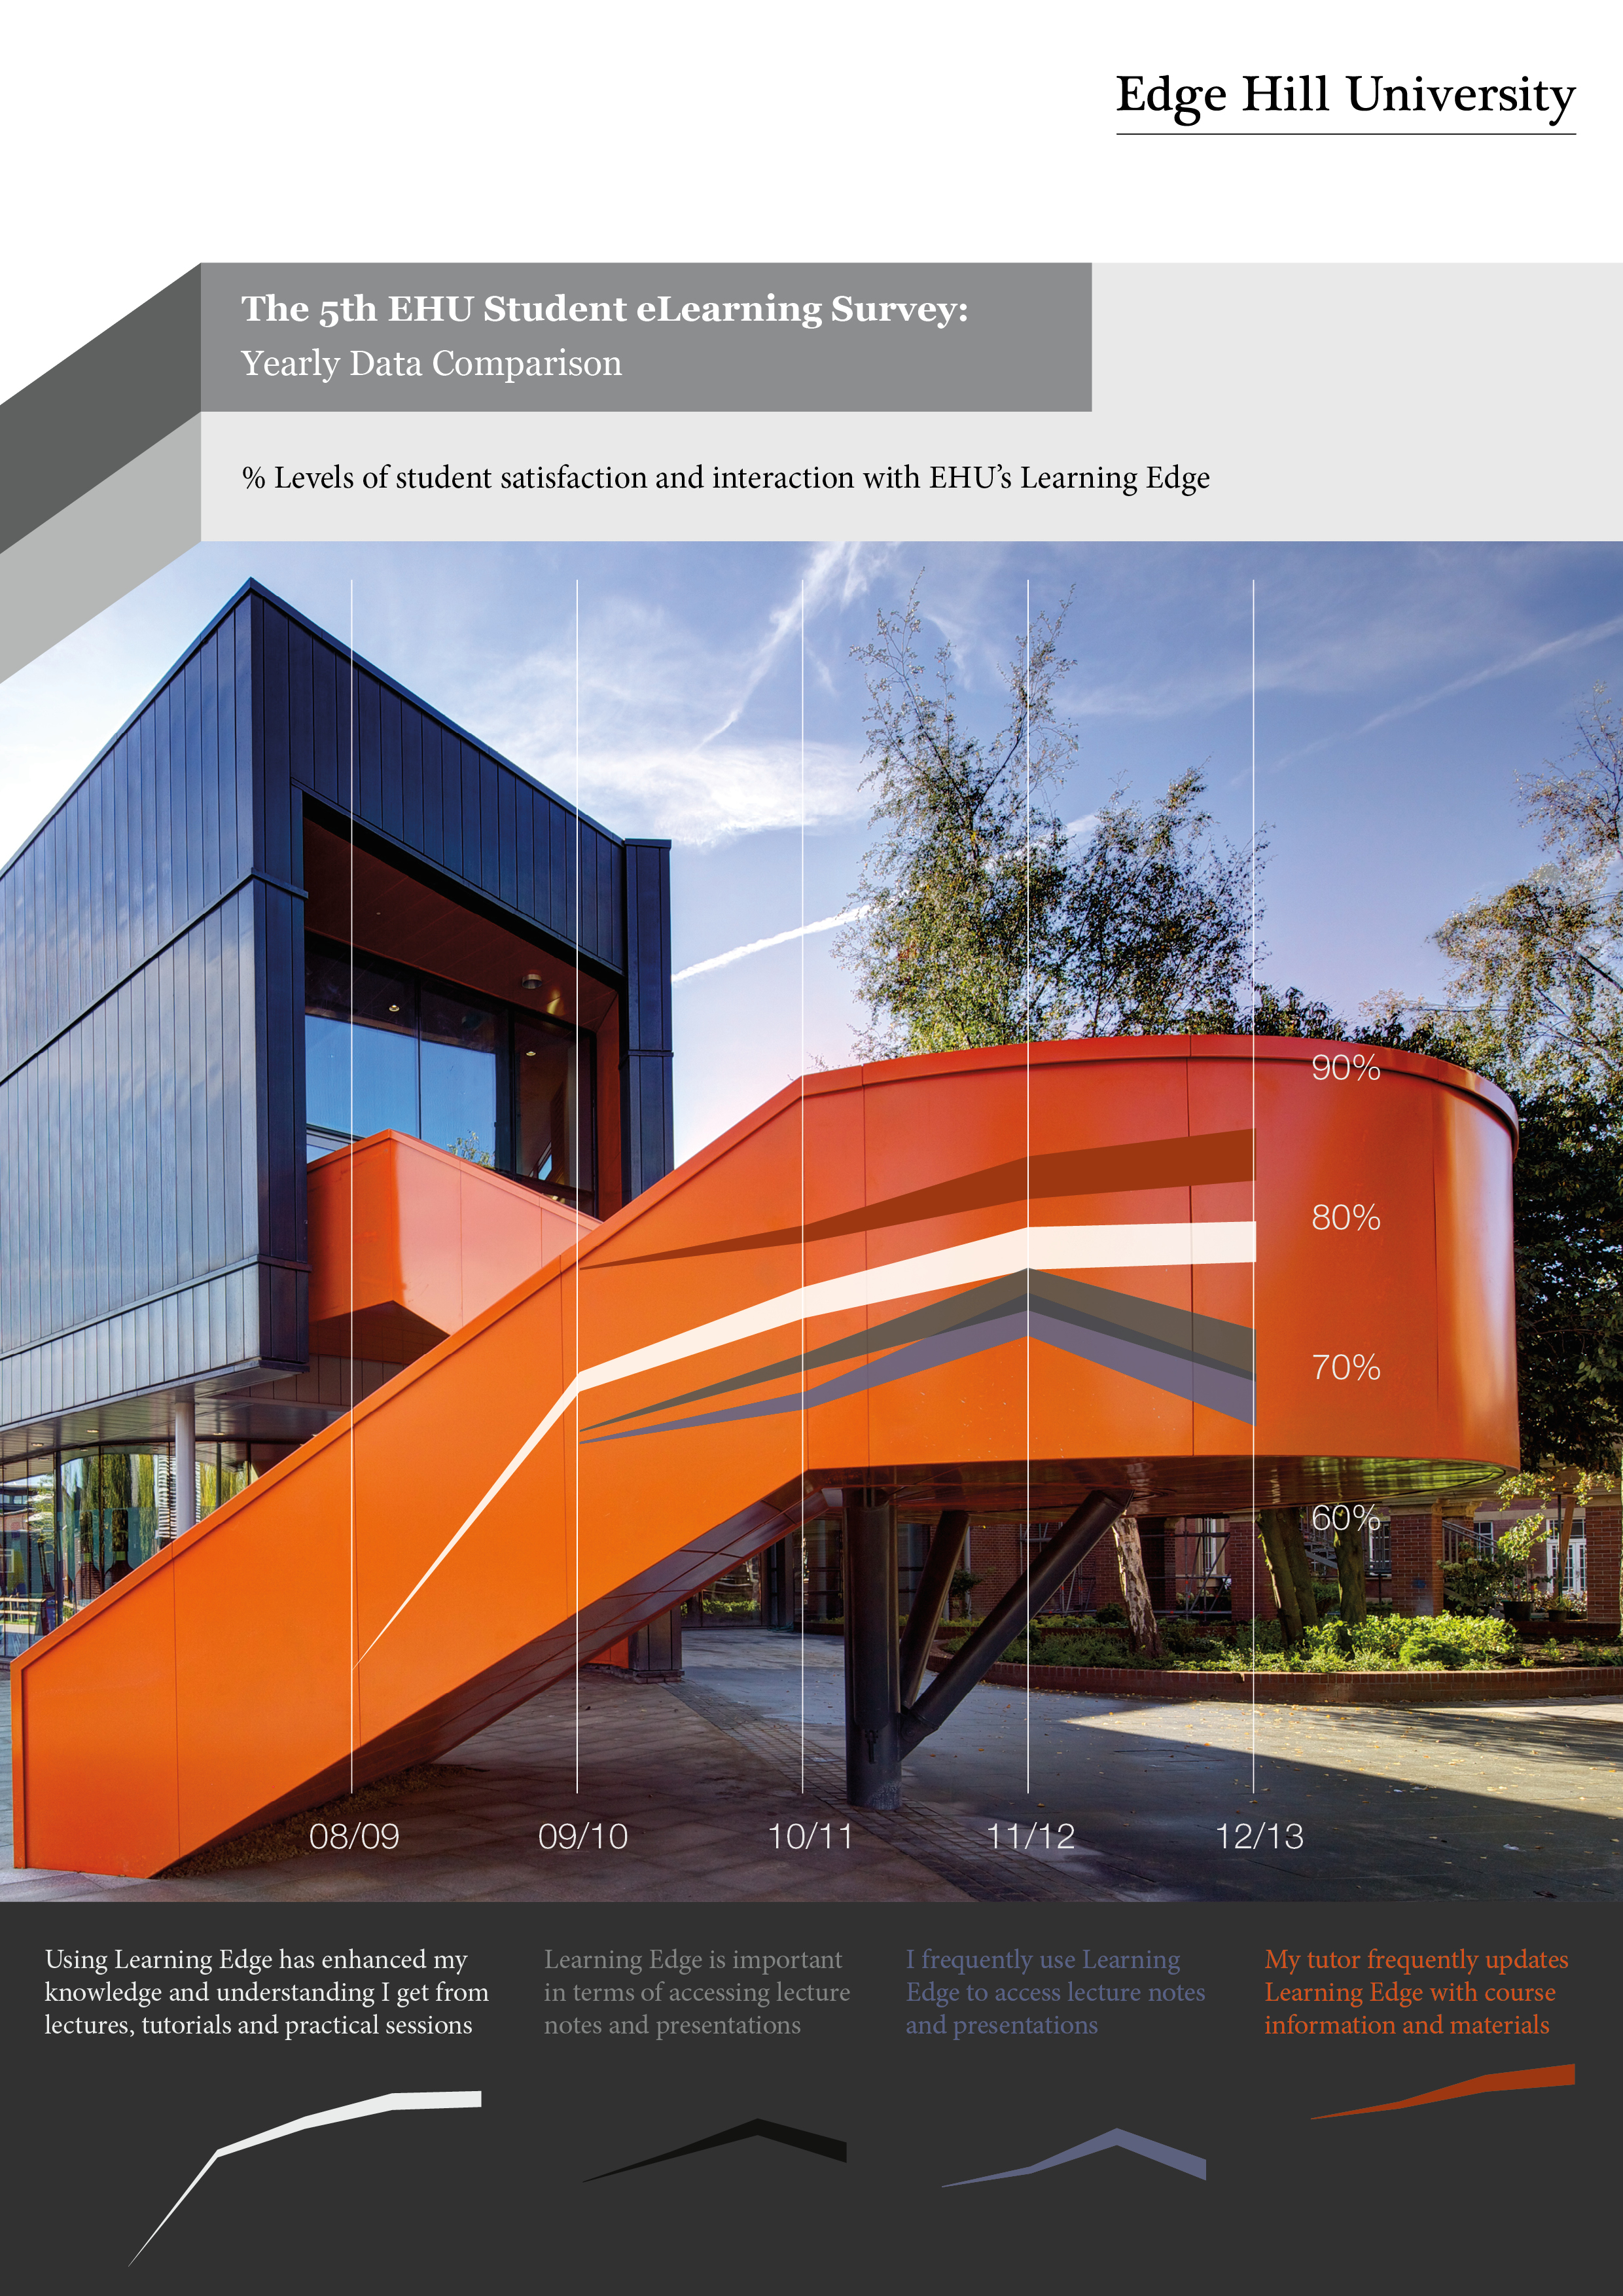
The 5th EHU Student eLearning survey closed in the spring of this year and we will be sharing the full report and feedback shortly, but we wanted to highlight some of the headlines using infographics. Using pictures to tell a story is nothing new but we have been looking over the past few months at how we can represent research data in an infographic. We can see many opportunities for communicating to our customers the messages from what in the past, they might have seemed like dry or complex data. Seeing the trends, figures and statistics which are contained in research can be really hard sometimes but the infographic brings the message to the foreground in a visually appealing way. Using a graphic can also very easily give your statistic some context, again, something which can be hard when you are writing a report.
A key element of the annual eLearning survey is seeing the trends in terms of the use of TEL and the VLE and also the technology the students are using to access learning.
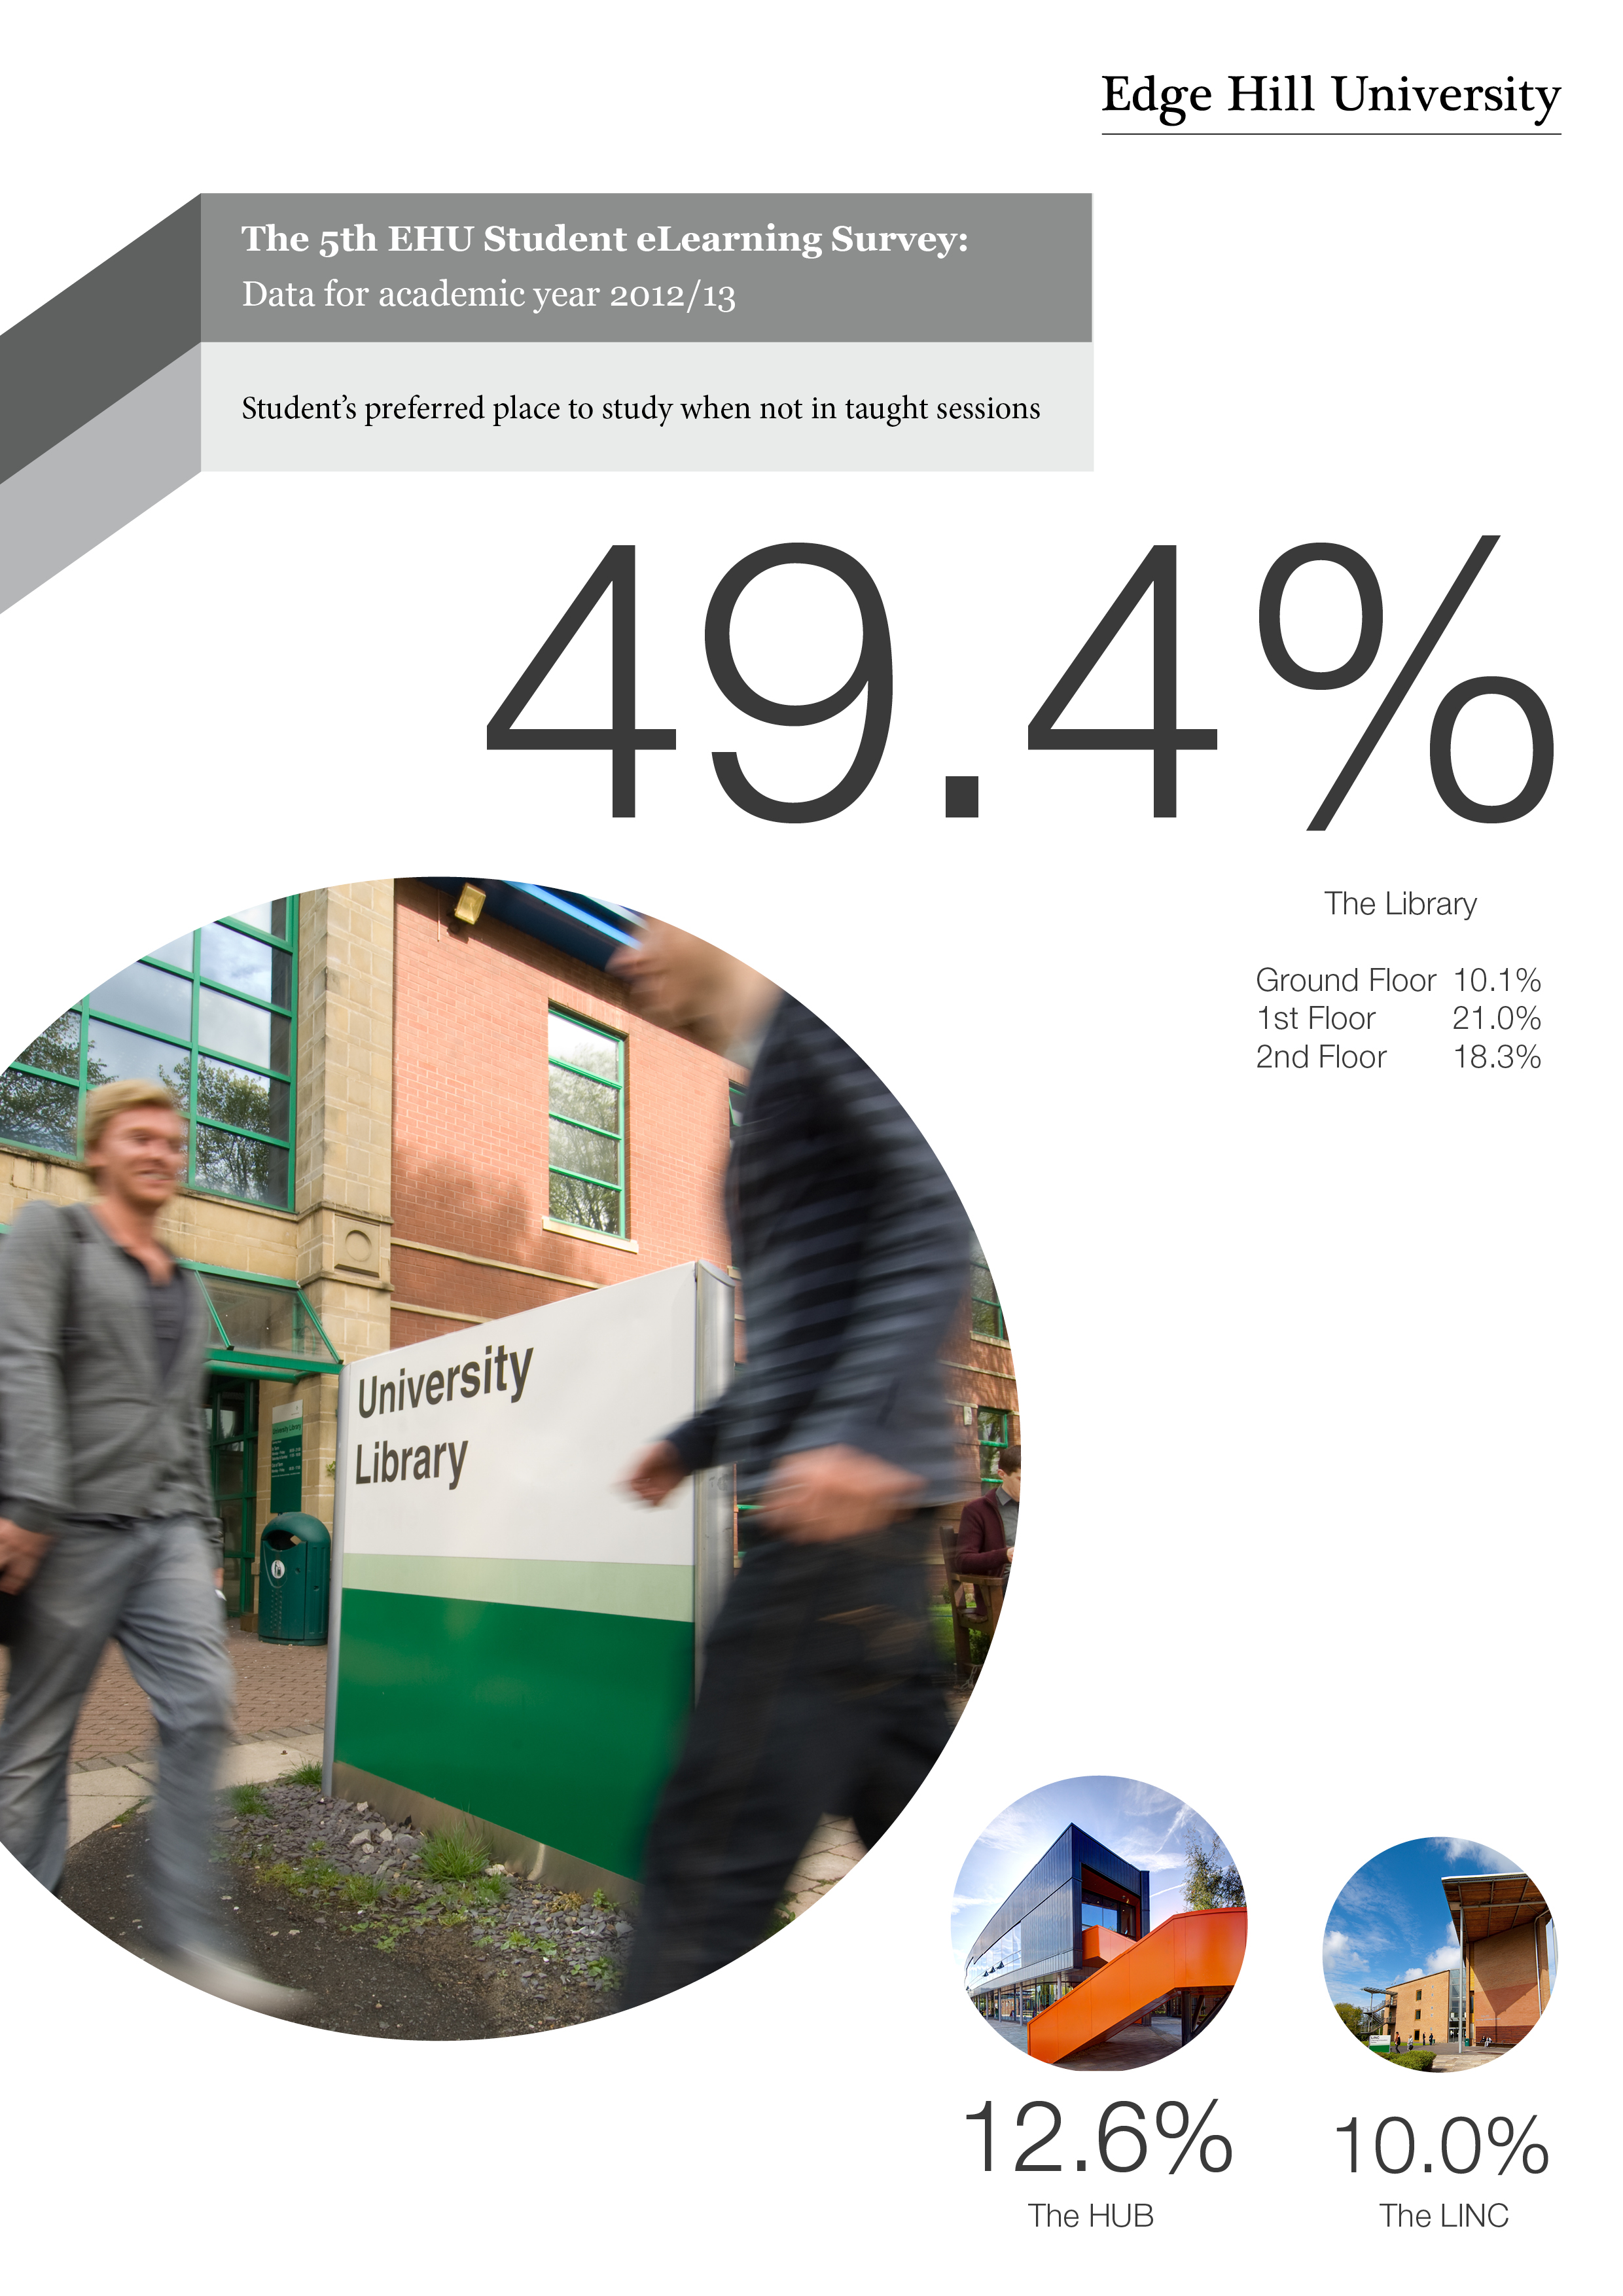
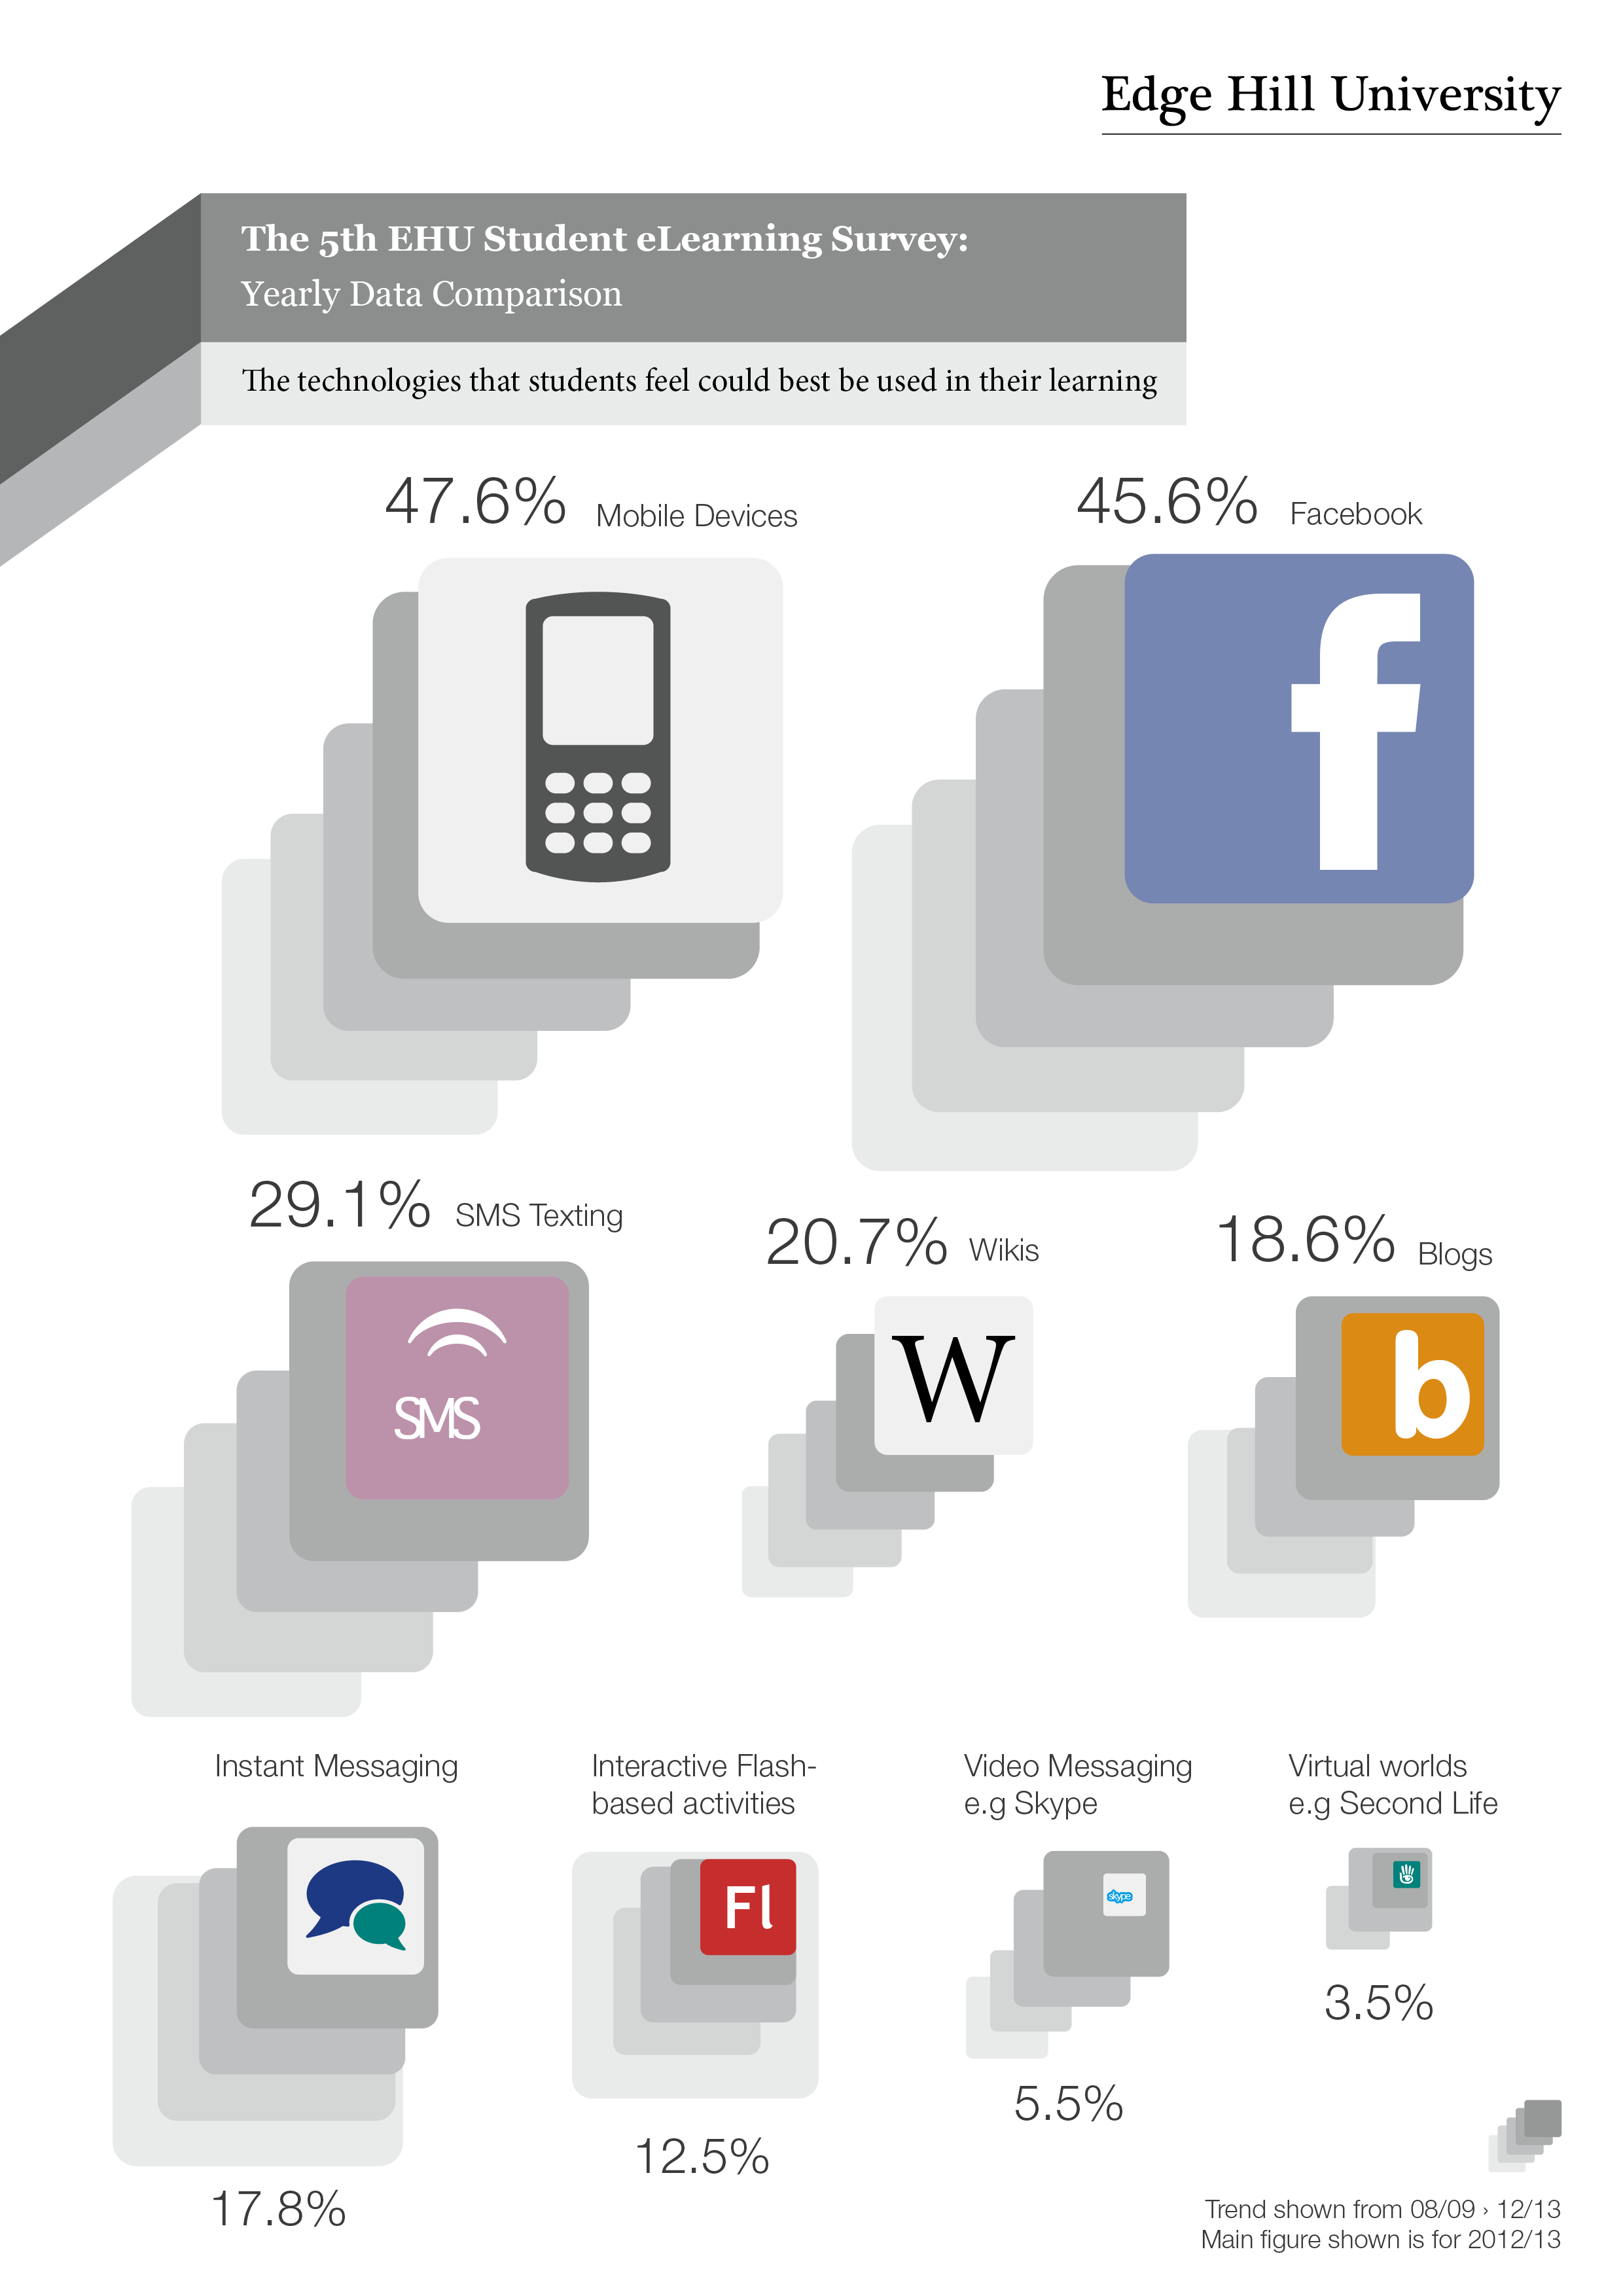
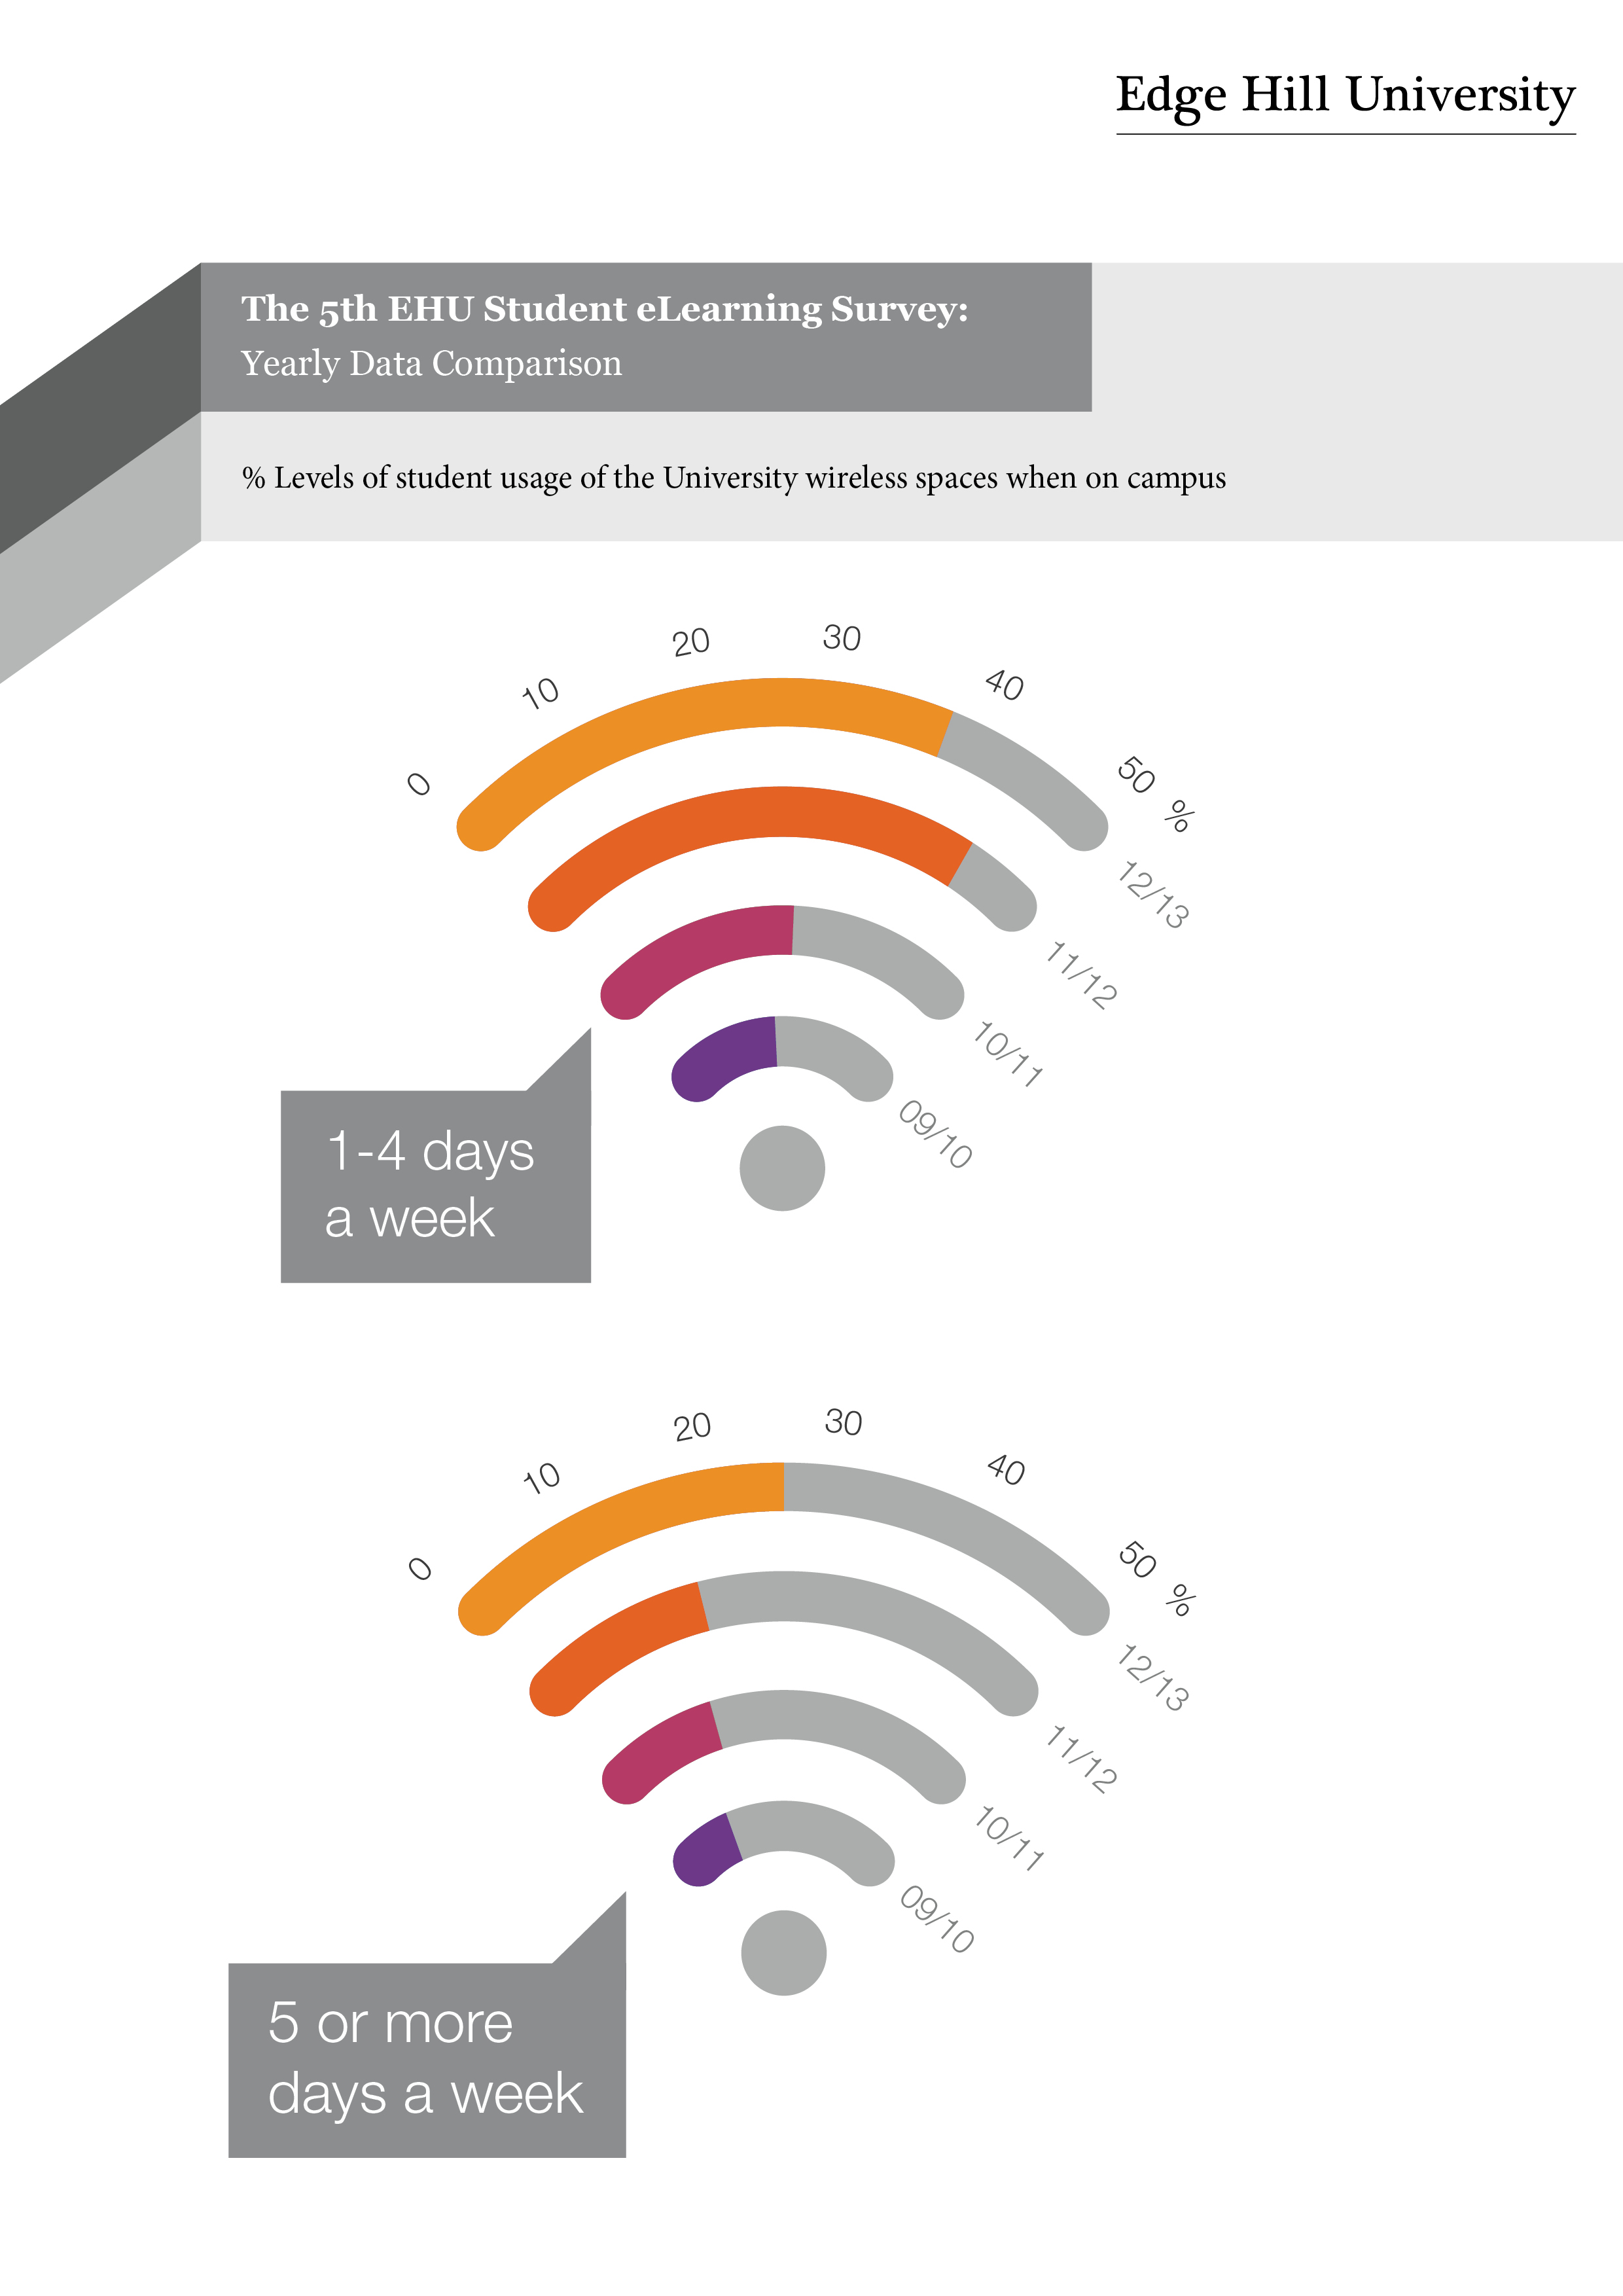
Here are 5 infographics showcasing the following; the increase in student satisfaction and interaction with Learning Edge; personal means of accessing the internet (we all know where that one is going!); preferred place of study on campus – it is still the library but we will be tracking in future how students are using our new student HUB; the technology students feel could be best used in terms of their learning; and bringing us back to our campus and the facilities, the increase in students using wireless on campus.
We hope you find these graphics more appealing that just a percentage statistic and we will be sharing more technology and Learning Edge data soon, along with some library statistics so if we can excite people about book issues by using graphics, it’s a result!


Rachel Bury
Academic Liaison Manager – Quality, Marketing and Communication